
Best Big Data and Open Analytics Infographics from 2012
This year, the only trend bigger than Big Data was infographics. We thought we would recap a year full of visual information and highlight those graphics that brought understanding to the world of Big Data and Open Analytics. Thus, without further ado, we invite you to enjoy our Top Big Data and Open Analytics Infographics from 2012.
1. Our first entry walks through types of data and tools for interpreting data. Sure, it’s narcissistic, but we love our own Understanding Big Data.
2. Big Data is a big flood for some. In IBM’s infographic, you can see opportunities for using Big Data for marketing.
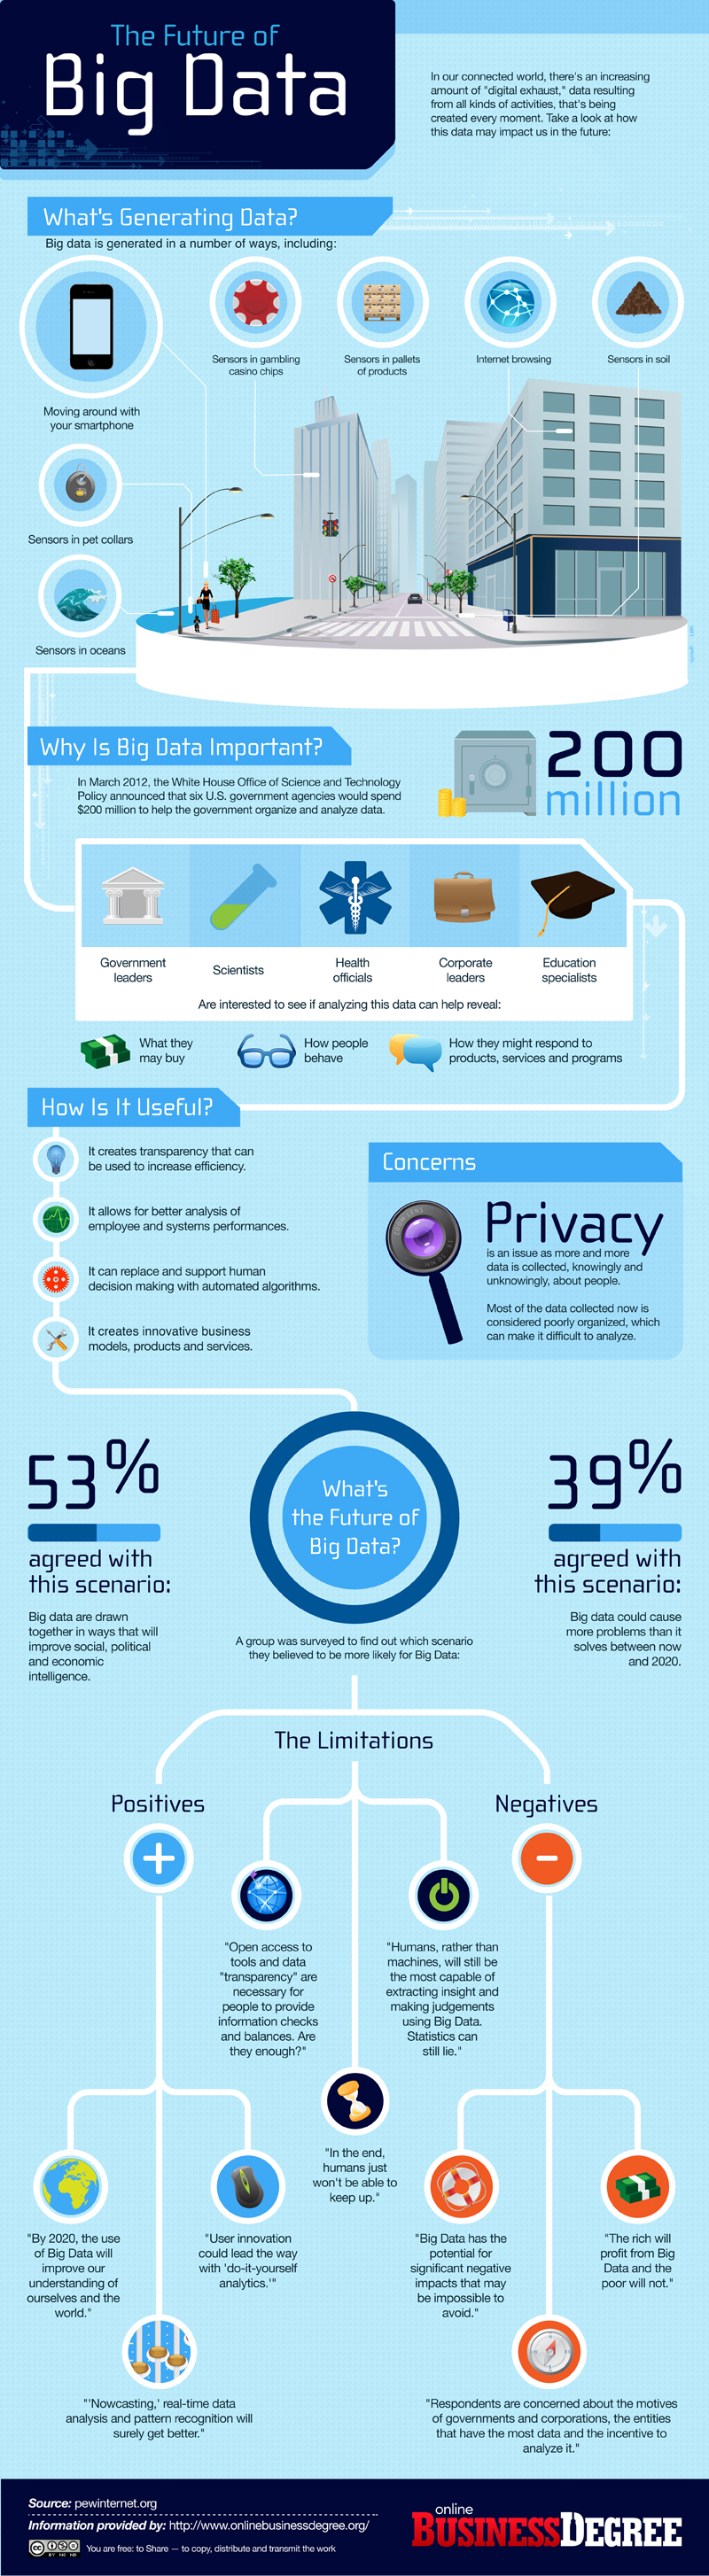
View the original at OnlineBusinessDegree.org
Join us as we move in to 2013 and stay on top of Big Data and Open Analytics. Subscribe to our blog on the right hand side. Here at IKANOW, we wish you happy holidays and happy data crunching!
No comments